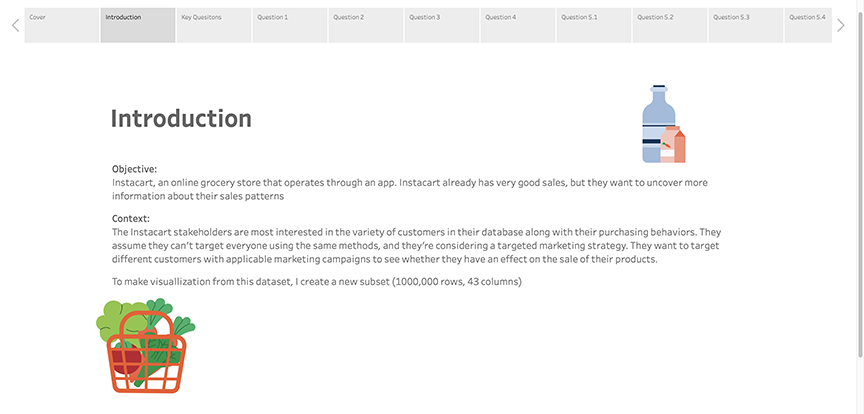
Objective
- Uncover more information about their sales patterns
- Derive insights and suggest strategies for better segmentation based on the provided criteria
Key Questions
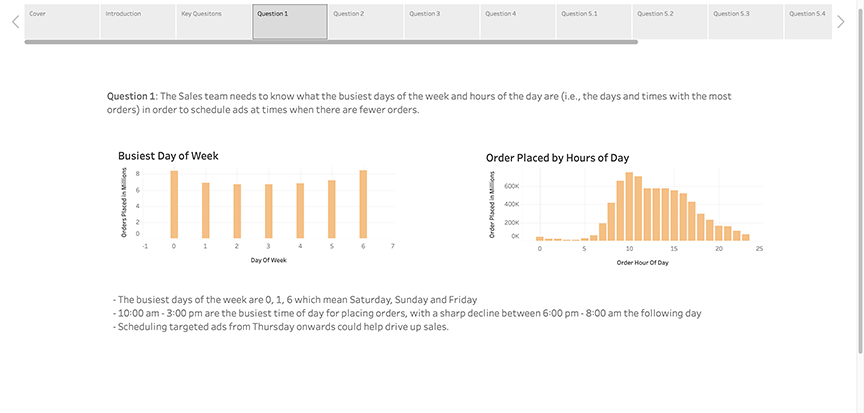
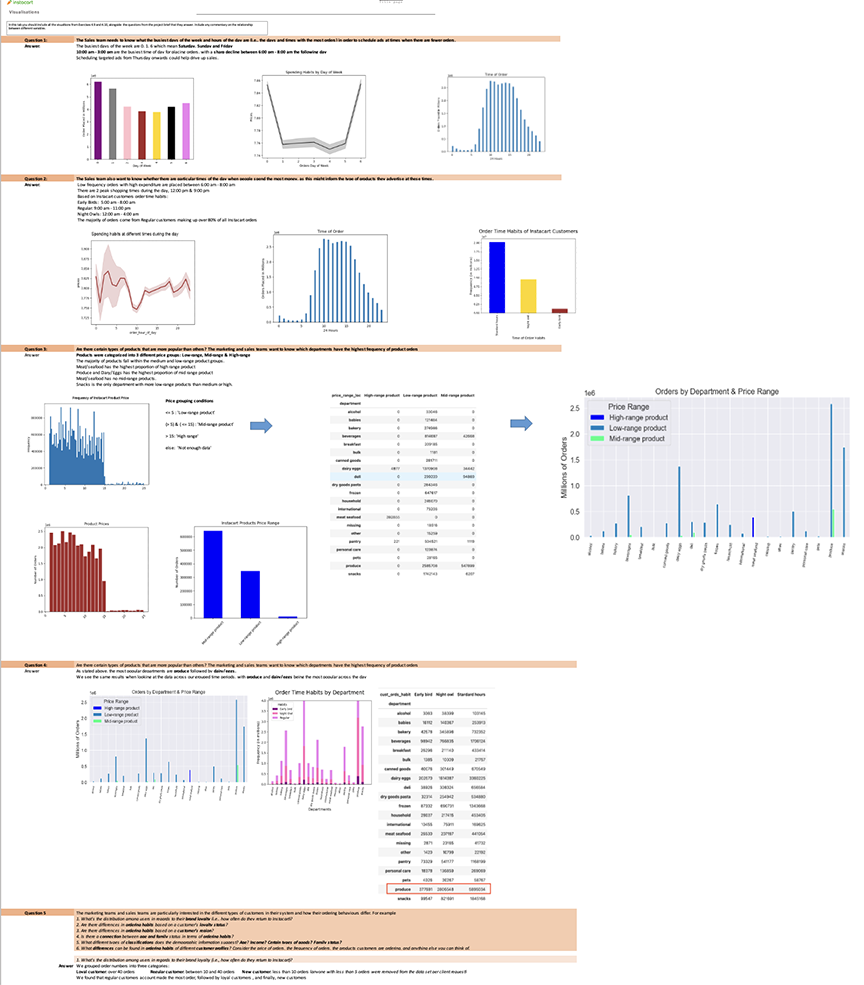
The sales team needs to know what the busiest days of the week and hours of the day
are (i.e., the days and times with the most orders) in order to schedule ads at times
when there are fewer orders.
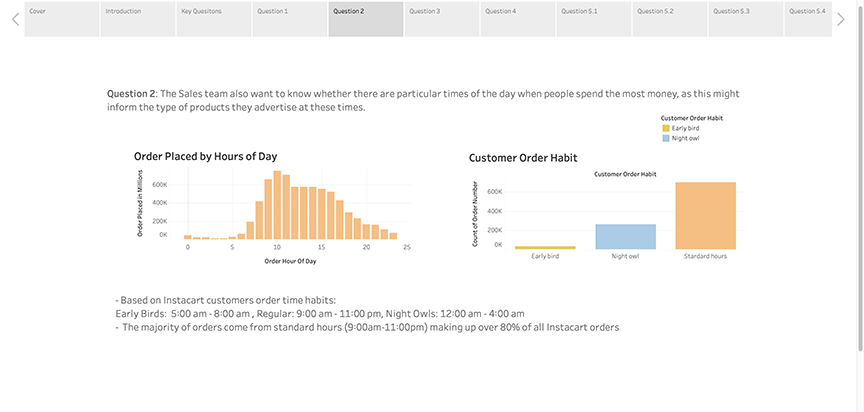
- They also want to know whether there are particular times of the day when people spend
the most money, as this might inform the type of products they advertise at these times.
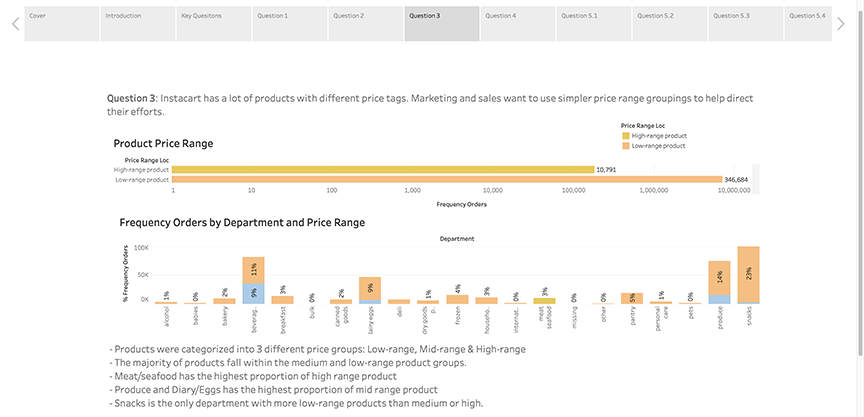
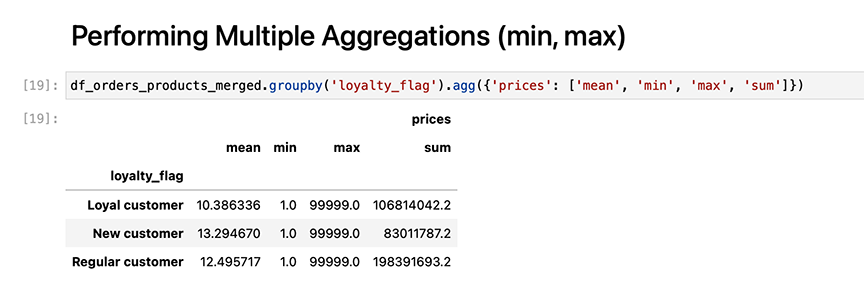
- Instacart has a lot of products with different price tags. Marketing and sales want to use
simpler price range groupings to help direct their efforts.
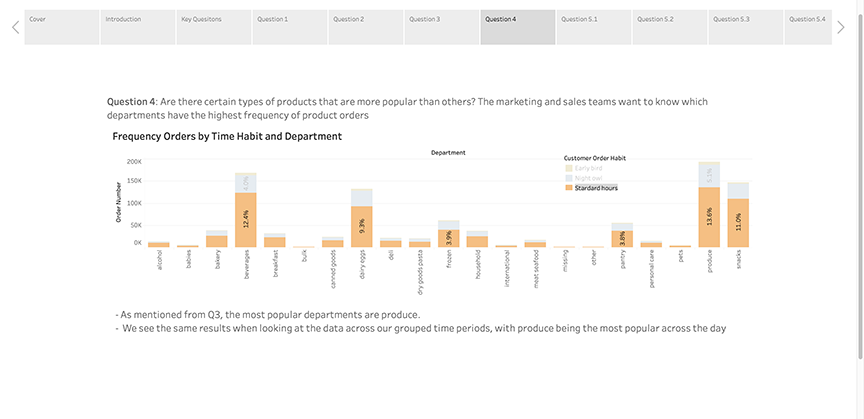
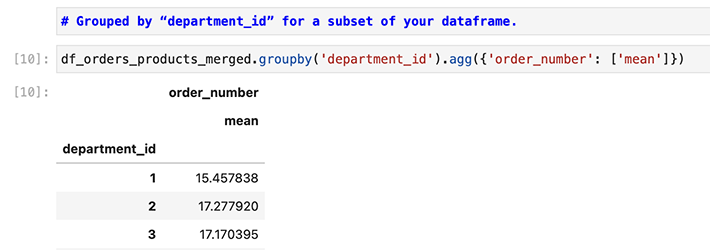
- Are there certain types of products that are more popular than others? The marketing
and sales teams want to know which departments have the highest frequency of product
orders.
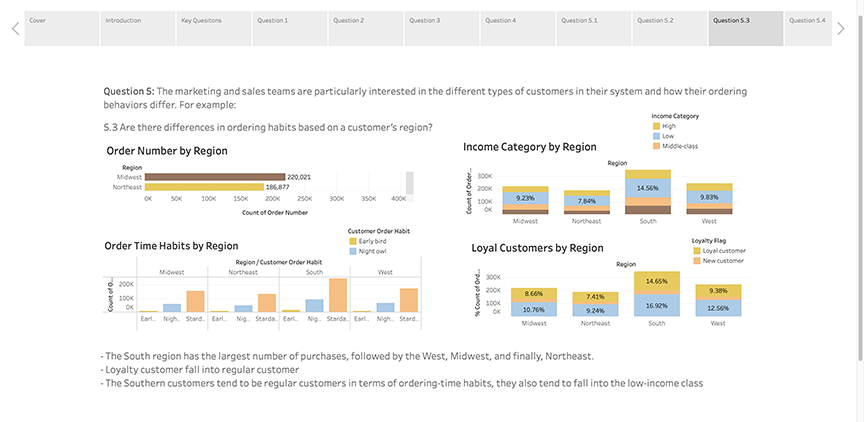
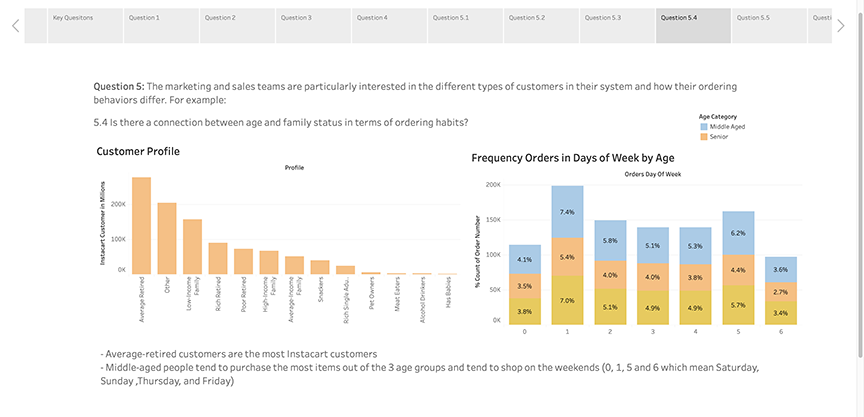
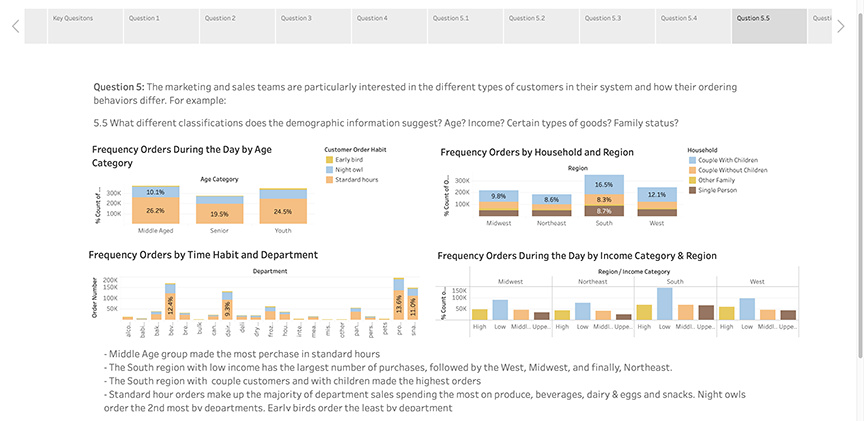
- The marketing and sales teams are particularly interested in the different types of
customers in their system and how their ordering behaviors differ. For example:
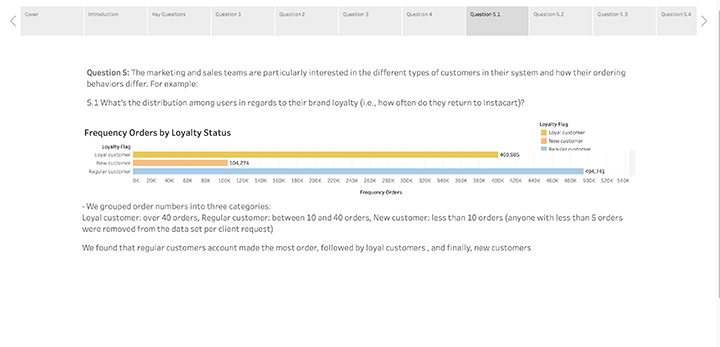
- What’s the distribution among users in regards to their brand loyalty (i.e., how
often do they return to Instacart)?
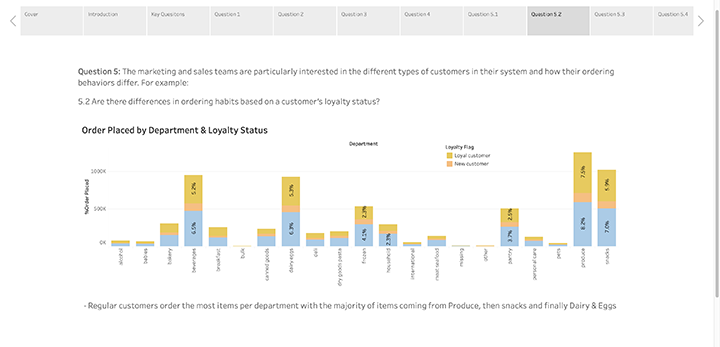
- Are there differences in ordering habits based on a customer’s loyalty status?
- Are there differences in ordering habits based on a customer’s region?
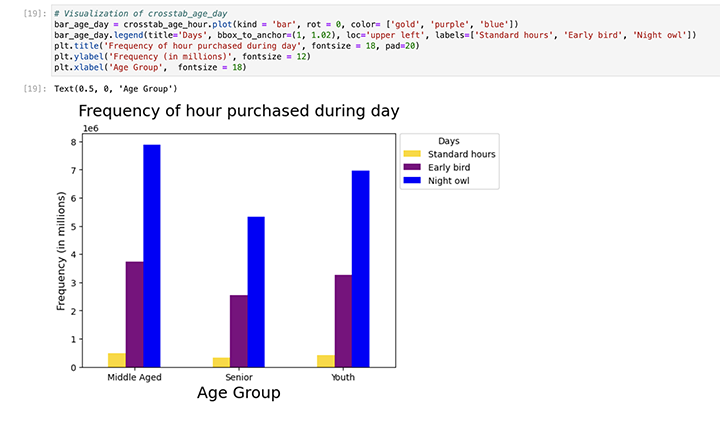
- Is there a connection between age and family status in terms of ordering habits?
Note: Instacart is a real company that’s made their data available online. However, the contents of this project brief
have been fabricated for the purpose of this Achievement.
- What different classifications does the demographic information suggest? Age?
Income? Certain types of goods? Family status?
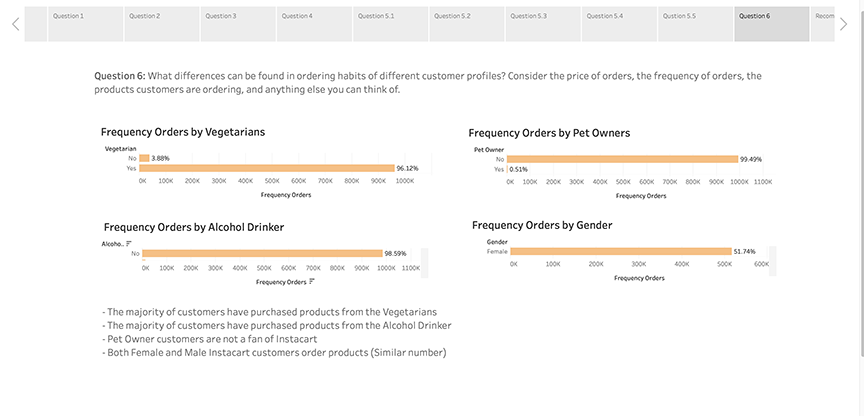
- What differences can you find in ordering habits of different customer profiles?
Consider the price of orders, the frequency of orders, the products customers are
ordering, and anything else you can think of.
Data Set
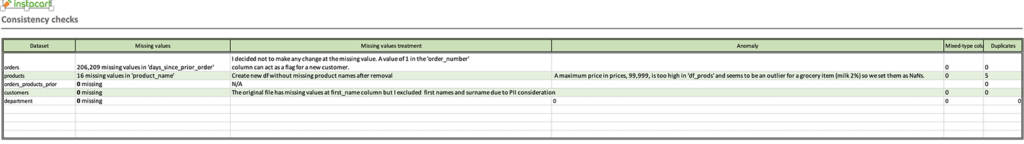
Data Quality
Analysis Data Process
Preparing and Analysis Data Process:
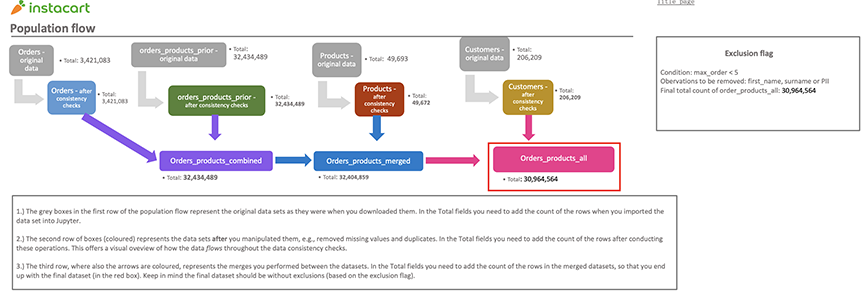
– Data Workflow
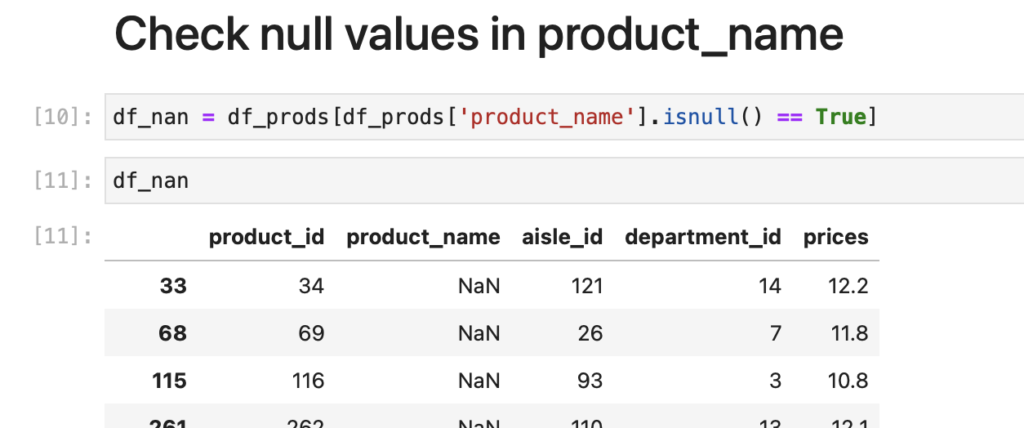
– Data Consistency Checks
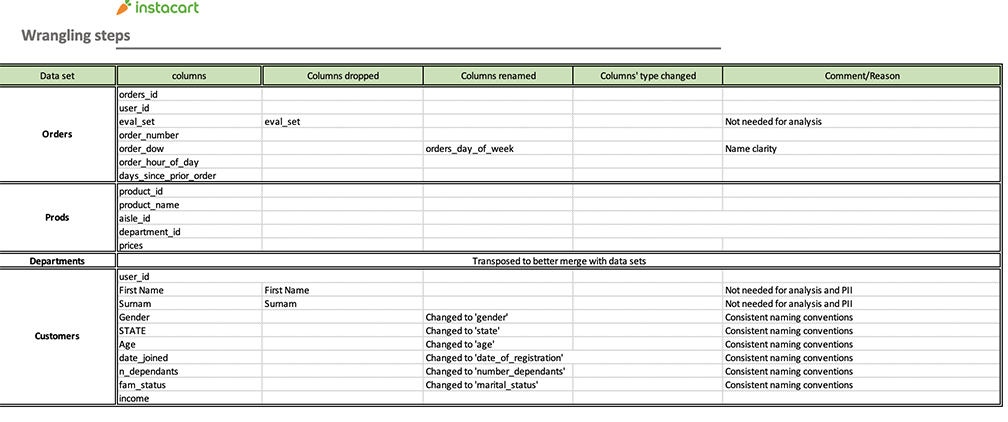
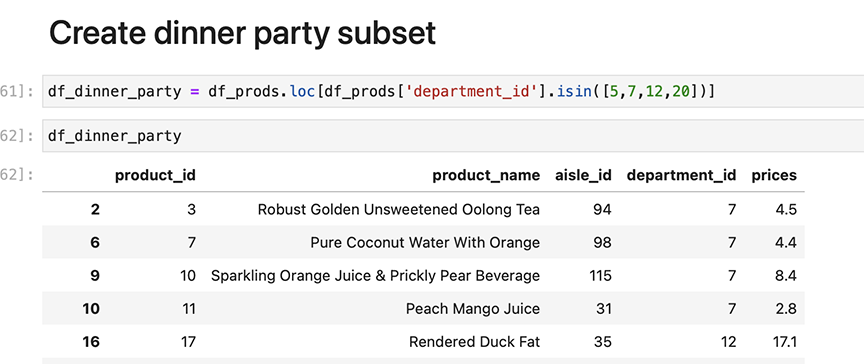
– Data Wrangling & Subsetting
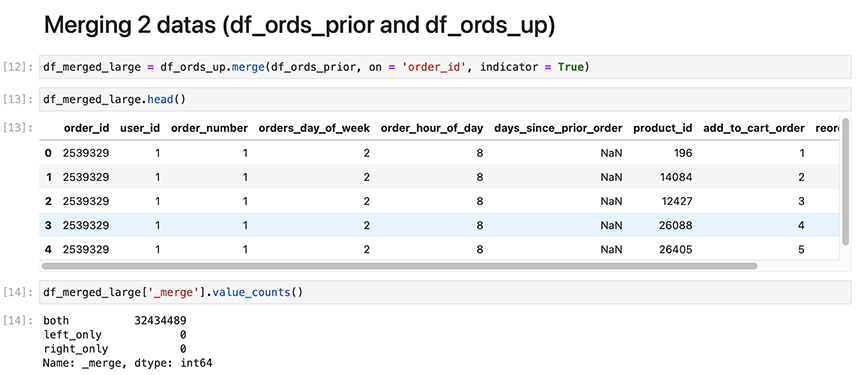
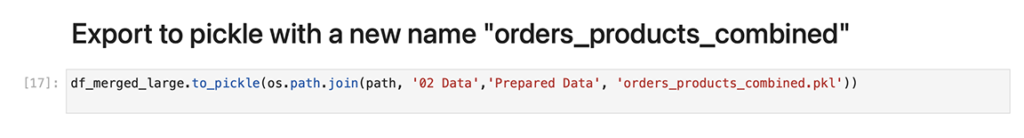
– Combining & Exporting Data
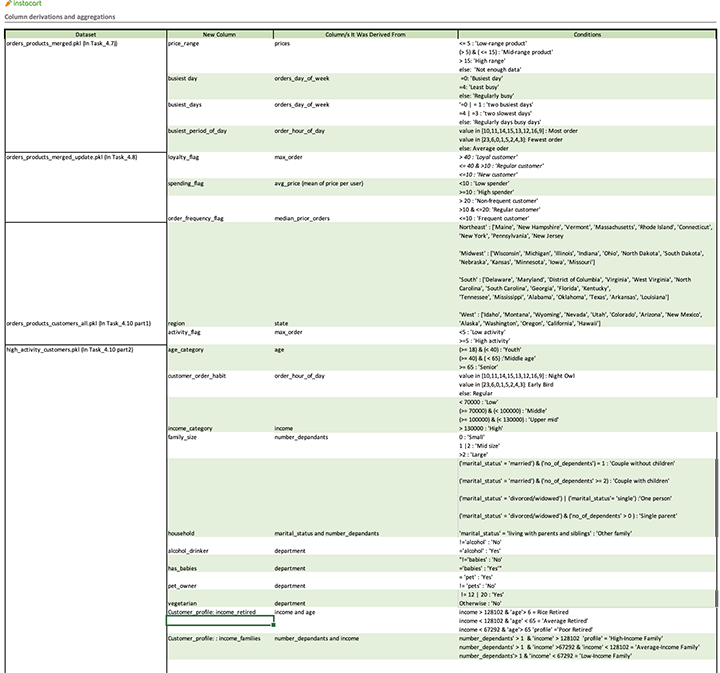
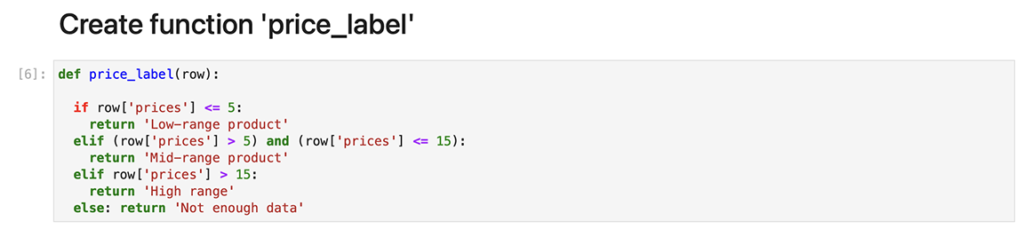
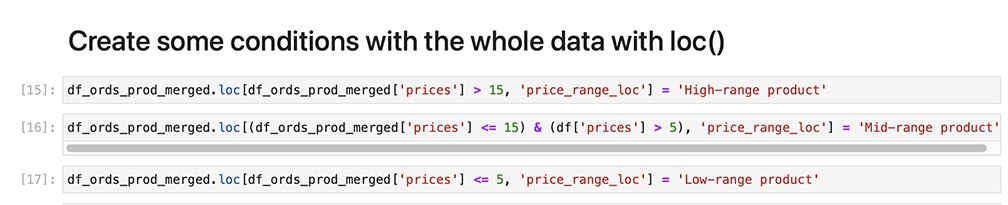
– Deriving New Variables
– Grouping Data & Aggregating Variable
– Visualization with Python
Data Visualizaton
3 key questions before start
- What Type of Data am i working with? Geospatial (Region) and Categorical (product items, product price range, departments, product orders, ordering habits, frequency of orders, customer information)
- What do i want to communicate? Comparison (Column Chart, Bar Chart) , Composition (Tree Map, Bar Chart, Column Chart)
- Who is the end user and what do they need? Stakeholders (Simple charts, Minimal Details). Derive insights and suggest strategies for better segmentation based on the provided criteria
Choose the Right Metrics
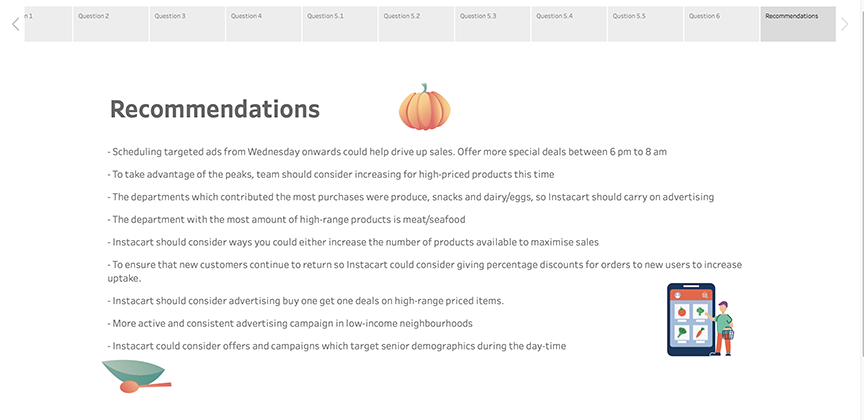
- Times: The days and times with the most orders (busiest days of the week and hours of the day) in order to schedule ads at times when there are fewer orders, day when people spend the most money
- Product Types (for example: certain type of product that more popular)
- Customer Behaviors
- Customer Information
- Orders (for example: number of orders, frequency orders,..,etc)
Layout
Context (* Context is a key)
- Context gives numbers meaning, and helps interpret them accurately so i used annotate points to show the meanings in my visualizations as well as the labels.