
Find out if the film table and the customer table contain any dirty data, specifically non-uniform or duplicate data, or missing values.
Identify Duplicates
Film Table
The result shows below and no duplicate values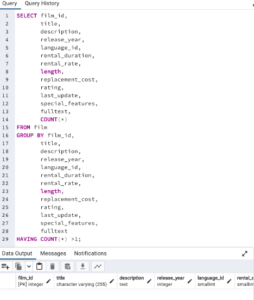
*Github’s link is coming soon
Customer Table
The result shows below and no duplicate values.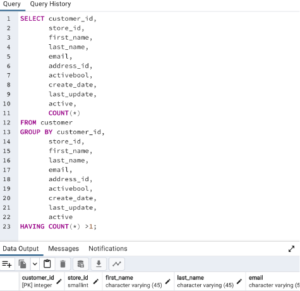
From both tables above, If there is duplicate data, there are two ways to fix them: 1. Create a virtual table, knows as a view, where you select only unique records 2. Delete the duplicate record from the table or view. And to analyze the data, there will be need to write a query that returns only unique records–by using group by and by using Distinct
None-Uniform Data
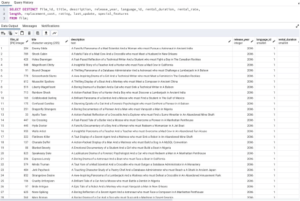
Film Table
The query below is for checking all columns but you can look closer by SELECT DISTINCT of each column and observe the result, as seen below
Customer Table
The query below is for checking all columns but you can look closer by SELECT DISTINCT of each column and observe the result, as seen below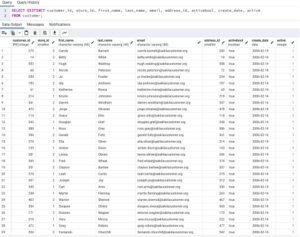
Summarize your data: Use SQL to calculate descriptive statistics for both the film table and the customer table. For numerical columns, this means finding the minimum, maximum, and average values. For non-numerical columns, calculate the mode value. Copy-paste your SQL queries and their outputs into your answers document.
Film Table
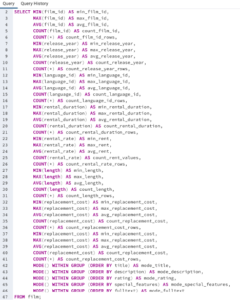
For numerical columns and none-numerical columns:
The result is in Excel file
Customer Table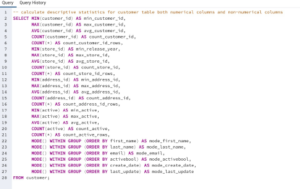
For numerical columns and none-numerical columns:
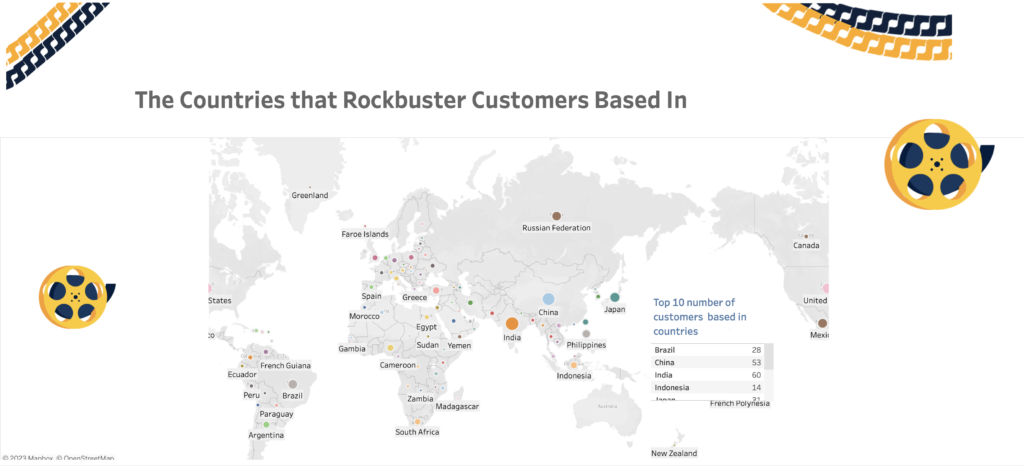
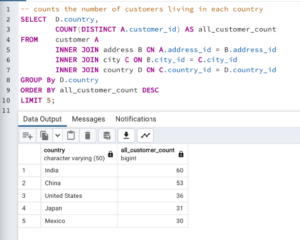
Find the top 10 countries for Rockbuster in terms of customer numbers.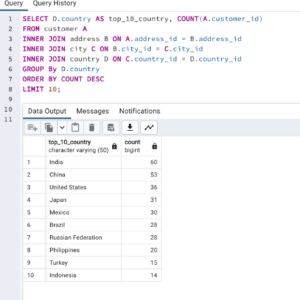
Find the top 10 cities within the top 10 countries identified in step 1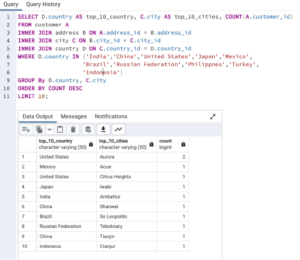
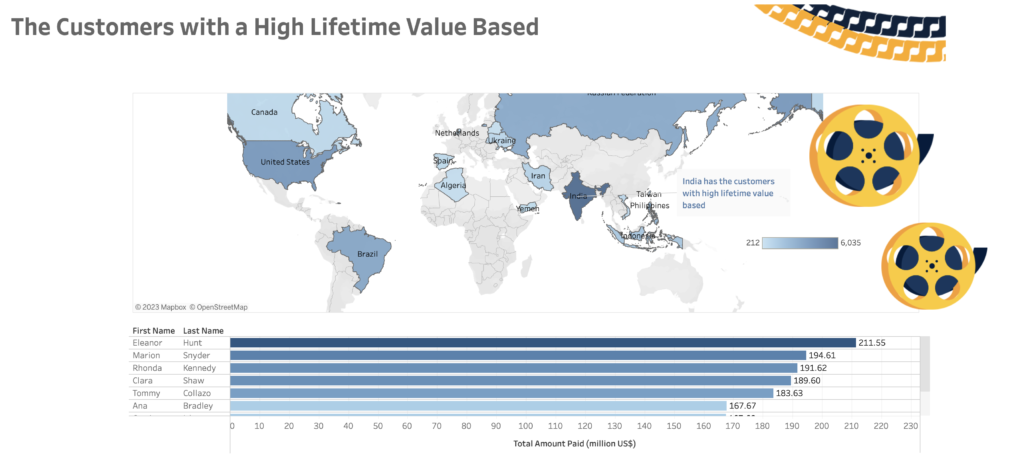
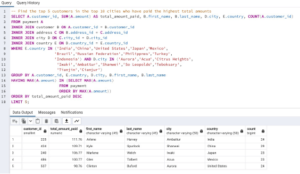
Find the top 5 customers in the top 10 cities who have paid the highest total amounts to Rockbuster. The customer team would like to reward them for their loyalty!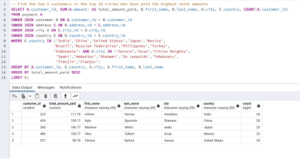
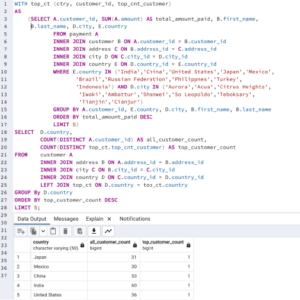
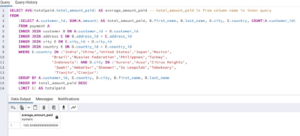
Find the average amount paid by the top 5 customers.
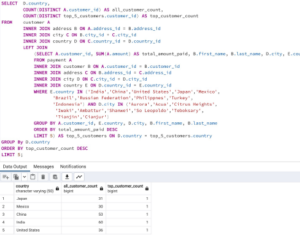
Find out how many of the top 5 customers are based within each country.
- Outer query
- Inner query
Subquery
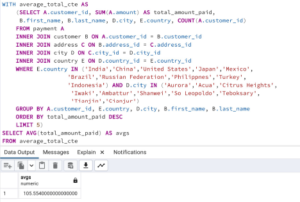
Rewrite queries from previous questions by using CTE
1.1 Find the average amount paid by the top 5 customers.
1.2 Find out how many of the top 5 customers are based within each country.